


Latest weekly Covid-19 rates for local authority areas in Wales
Register for free to read more of the latest local news. It's easy and will only take a moment.
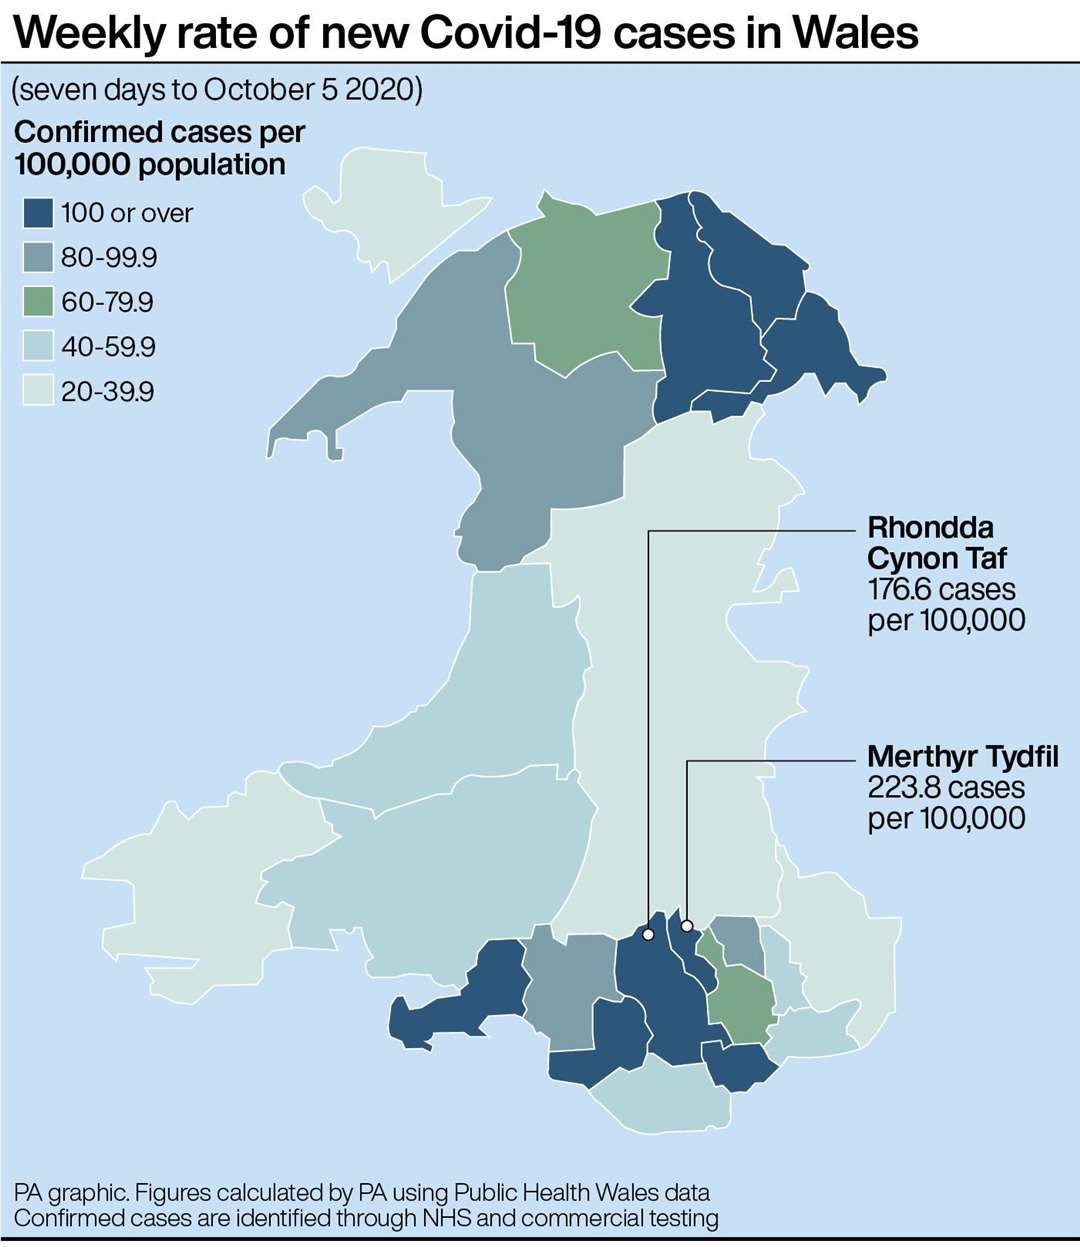
Here are the latest figures for the seven-day rate of new Covid-19 cases for every local authority area in Wales.
The figures, for the seven days to October 5, are based on tests carried out in NHS Wales laboratories and tests conducted on Welsh residents processed in commercial laboratories.
The rate is expressed as the number of new cases per 100,000 people.
Data for the most recent three days (October 6-8) has been excluded as it is incomplete and likely to be revised.
The list has been calculated by the PA news agency and is based on data published on the Public Health Wales Covid-19 surveillance dashboard on October 8.
From left to right, the list reads: name of local authority; rate of new cases in the seven days to October 5; number (in brackets) of new cases recorded in the seven days to October 5; rate of new cases in the seven days to September 28; number (in brackets) of new cases recorded in the seven days to September 28.
Merthyr Tydfil 223.8 (135), 218.8 (132)
Rhondda Cynon Taf 176.6 (426), 185.3 (447)
Flintshire 144.1 (225), 56.4 (88)
Swansea 133.6 (330), 99.6 (246)
Wrexham 132.4 (180), 60.3 (82)
Bridgend 131.2 (193), 114.9 (169)
Cardiff 120.7 (443), 103.0 (378)
Denbighshire 101.4 (97), 46.0 (44)
Neath Port Talbot 98.4 (141), 57.9 (83)
Blaenau Gwent 83.0 (58), 261.9 (183)
Gwynedd 82.7 (103), 16.1 (20)
Conwy 63.1 (74), 53.8 (63)
Caerphilly 60.2 (109), 53.0 (96)
Torfaen 58.5 (55), 57.5 (54)
Vale of Glamorgan 56.9 (76), 48.7 (65)
Carmarthenshire 53.5 (101), 69.4 (131)
Newport 45.3 (70), 62.7 (97)
Ceredigion 44.0 (32), 27.5 (20)
Powys 31.0 (41), 23.4 (31)
Monmouthshire 30.7 (29), 23.3 (22)
Pembrokeshire 23.0 (29), 10.3 (13)
Isle of Anglesey 21.4 (15), 14.3 (10)