


New interactive map showing coronavirus risk to Highland communities could help phase lifting of lockdown
Register for free to read more of the latest local news. It's easy and will only take a moment.

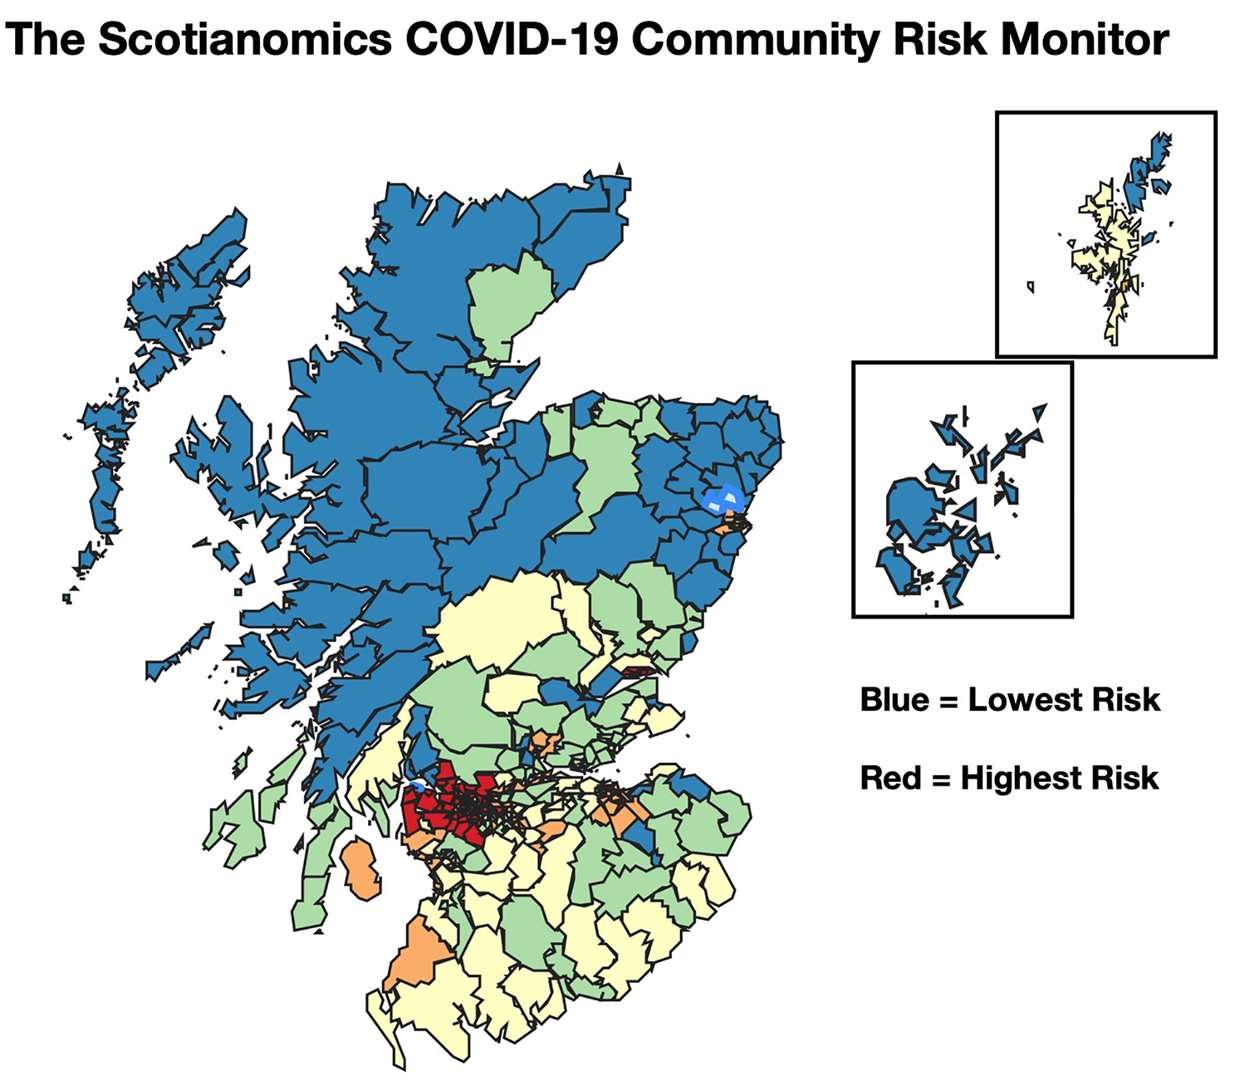
A new interactive map of Scotland has revealed communities in the Highlands are among those facing the lowest risk of coronavirus transmission.
The freely-accessible colour-coded map, compiled by a think tank of researchers and analysts, ranks Scotland's 354 local authority wards in order of risk.
In the Inverness area, the highest-placed ward is Inverness Central ward which is ranked 274 followed by Nairn and Cawdor which is ranked 297 and the Black Isle at 307.
Inverness South emerges as the safest ward in the area, placed at 350 in the table.
It has been created by Scotianomics, of Glasgow, using existing data to calculate each area’s risk of exposure according to transmission probability and potential for fatalities.
The organisation says it could help guide Scottish Government policy on lifting lockdown restrictions on a phased, geographic basis depending on the risk levels within individual communities.
The data used to compile the map includes population density, the number of older people or those with underlying health conditions, how many people use road and rail travel and access local health services and socio-economic factors such as the average incomes of residents.

Gordon MacIntyre-Kemp, founding director of Scotianomics, said: “The public and business reaction to coronavirus is highly-charged and often emotional.
"We believe this geographic breakdown can help the national response to provide clear analysis of existing data
“What is evident is that, for a wide variety of reasons, the risks vary hugely in different communities across Scotland. In terms of both the economy and health and wellbeing, we believe it makes sense to ease the lockdown according to those regional differences in risk.
“There has already been a great deal of debate on whether the four nations within the UK should ease restrictions in lockstep, despite the fact that Oban is likely to have a completely different risk profile to Tower Hamlets in London. What our research shows is that there are also significant variations even within Scotland.
“Across the world, other countries, including China, Italy and Germany, responded to the initial threat on a regionalised basis and are now lifting lockdown according to regional variations. Our research suggests this is the most likely way to prevent a second wave and to protect the economy.”
The research was conducted during April and has been submitted to the Scottish Government’s advisory group on economic recovery.
Currently, the research does not factor in actual infection rates or fatalities which may have been recorded in each area as these figures are not publicly available in sufficiently detailed form.
Scotianomics has pledged that it will update the online tracker as new datasets become available.
“We want to be absolutely clear," Mr MacIntyre-Kemp said.
"This is nothing to do with the number of cases in an area or how well people living in each area have observed the lockdown.
"It is not a map of Covid-19 cases across Scotland but of the areas most at risk of community infection.
“However, what it sets out very clearly is that the risks of transmission and the likelihood of fatalities within particular communities can be predicted with a high degree of confidence."
Coronavirus transmission risk rankings to communities in the Highlands include:
Inverness Central (ranked 274)
Wester Ross, Strathpeffer and Lochalsh (288)
Nairn and Cawdor (297)
Tain and Easter Ross (305)
Black Isle (307)
Inverness West (309)
Inverness Ness-side (310)
Inverness Millburn (311)
Aird and Loch Ness (317)
Dingwall and Seaforth (320)
Cromarty Firth (330)
Culloden and Ardersier (336)
Inverness South (350)
The online map can be viewed at www.scotianomics.org/covid19-risk-monitor
Related article: Death toll in NHS Highland area stands at 103
Click here for more coronavirus news